

Our Methods
The Country Study
TASAI is built on in-depth country studies conducted by the TASAI team in close collaboration with local seed industry experts (“country researchers”). Most country teams consist of a leading academic paired with a seed industry professional, a combination that ensures rigor, knowledge about the seed industry, and access to the right information sources and data. In each country, TASAI focuses on four crops (called “focus crops”) that are important to food and nutritional security. The primary output of a country study is the country report, which combines primary data collected from interviews with seed companies, plant breeders, government officials, and other seed industry representatives with relevant secondary data. The country report also offers comparisons across time and with other countries where TASAI has collected data. The data are presented in the TASAI Dashboard, an interactive database that allows users to examine TASAI data in depth through visualizations and custom search queries.
To ensure the highest quality data, TASAI’s research methods are guided by the interrelated principles of Accuracy, Simplicity, and Transparency.
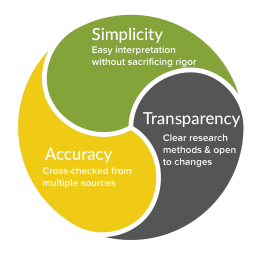
TASAI studies make extensive use of digital technology through online data collection tools (KoboCollect) used by researchers in the field, an online data validation and analysis tool (built on Metabase), and the TASAI Dashboard. The use of digital technology ensures a high level of accuracy and allows the TASAI team to work efficiently and share findings easily and widely.
Stakeholder Engagement is a hallmark of the TASAI methodology: each country study commences with a consultation with local seed industry stakeholders and culminates in a dissemination event, during which the results are validated with members of the country’s seed industry. This open communication ensures engagement and buy-in from local stakeholders.
TASAI Indicators
The idea of a tool that monitors the development of Africa’s seed sector was conceived in 2010. Over time it evolved from a concept to implementation following wide consultation with seed industry stakeholders and leading researchers working on indexes. The indicators used in TASAI were developed from preexisting knowledge, industry survey, and lessons from the pilot studies:
Pre-existing knowledge: First, we surveyed the existing literature on the building blocks of enabling environments for agro-industries. We then consulted with key seed sector informants to come up with a long list of relevant variables. Consultation with several established indexes guided the target numbers and classification of indicators.
Industry survey: Second, we surveyed African seed sector players to evaluate the importance of each indicator, thus creating a smaller subset of key indicators. The survey was completed by 167 respondents, including private seed companies, non-governmental organizations, government departments, and research institutions.
Lessons from pilot: In 2013-2014 TASAI concluded pilot studies in Kenya, Uganda, South Africa, and Zimbabwe. Key lessons from these pilot studies both sharpened the focus on the index and added four new indicators.
Over the next few years, the team continued to tweak the methodology with minimal changes to the indicators. TASAI’s design is closely aligned with the central objective of the tool and its intended audience(s), which have remained largely unchanged; at the same time, key choices have been made on data sources, aggregation methods, treatment of variables, index reporting, and on how to address changes over time.
The table below shows the 22 TASAI indicators. Some indicators are measured independently for each focus crop, while others are sector-wide. The last column shows the hypothesized impact of increased indicator performance on seed access by smallholder farmers.
| Indicators | Description | Theory of Change | Crop-specific | Impact on Seed Access |
|---|---|---|---|---|
| A. RESEARCH AND DEVELOPMENT | ||||
| A1. Adequacy of active breeders | Number of active breeders in public and private sectors. Breeders may work at national research institutions, universities, or seed companies; breeders employed by foreign-owned seed companies who are based outside of the country are excluded from count. | A functioning seed system needs vibrant public and private breeding programs to develop improved varieties that respond to farmer and consumer needs. The number of active breeders is indicative of the level of investment in research and development. | YES | + |
| A2. Number of varieties released | Number of crop varieties released, sold, and dropped | The number of varieties released is a good measure of outputs from the variety development and release system. More varieties released often translates to more varieties commercialized thereby increasing farmers’ choice. | YES | + |
| A3. Number of varieties with ‘special’ attributes/ features |
Number (and percentage of total) of released varieties with features such as:
Calculated as percentage of all varieties released in the last 3 years |
In addition to higher yields, new varieties often carry desired traits that are of value to farmers and/or final consumers. These traits include climate smartness, disease/pest resistance and nutrition-enhancements. | YES | + |
| A4. Availability of basic seed | Volume, sources, and procedures to access basic seed; based on information reported by seed companies and the National Agricultural Research System (NARS) | Basic seed, also known as foundation seed, is the parent material required for the production of commercial seed. Timely access to sufficient and high quality basic seed is of critical importance, especially for small seed companies that cannot maintain their own basic seed. | YES | + |
| B. INDUSTRY COMPETITIVENESS | ||||
| B1. Number of active seed companies/producers | Number of registered seed companies/producers that produced, and/or imported, and/or marketed certified seed in the data collection year. | Competition breeds excellence! The presence of more active seed companies increases competition and creates incentives for companies to innovate and improve. A vibrant seed sector depends on a robust private sector in which seed companies invest in the development, production, processing and marketing of improved varieties to farmers. | YES | + |
| B2. Quantity of seed produced and sold | Volume of certified seed produced and sold by crop. Information is obtained from two sources: (i) aggregated data from seed company responses and (ii) seed production volumes certified by the government | Holding everything else constant, the more seed produced and sold, smallholder farmers have more and better choices of improved seed. | YES | + |
| B3. Number of varieties sold and dropped | Number and names of varieties sold and dropped by seed companies/producers in data collection year. | For every crop, the number of varieties sold in any given year is a good indicator or the breadth of farmers’ choice. In addition, a vibrant seed sector should retire old varieties as newer (better) ones become available and discontinue varieties that fail to meet farmer needs. | YES | + |
| B4. Average age of varieties sold |
Average age of varieties sold by companies/producers based on the year the variety was released. Data sourced from national variety catalogue. Calculated as simple or volume-weighted average, depending on data availability. |
Newer varieties often outperform older varieties as they are bred for traits that respond to farmer, consumer and industry-demands. In vibrant seed systems, farmers regularly replace old varieties with new ones. | YES | – |
| B5. Market concentration | Market share of top four seed companies (volume-based) and market concentration as measured by the Herfindahl-Hirschman Index (HHI). | Competition among seed companies benefits farmers via lower prices, wider choices, increased innovation and better customer service. | YES | – |
| B6. Market share of state-owned seed company | Market share of state-owned seed company calculated based on reported volume of sales as a percentage of total seed sales, by crop. (Note: State-owned company may be former parastatal, public university, or NARI subsidiary, registered as a seed company and is engaged in the production and marketing of certified seed.) | In some countries, public entities are still active players in the marketing and sale of certified seed. Such state-owned companies often benefit from preferential treatment, less stringent enforcement of regulations, access to competitor information, and indirect production subsidies. Collectively these privileges can result in unfair competition against purely private seed companies. | YES | – |
| B7. Efficiency of seed import/export processes | Efficiency of import/export processes as measured by length of process, import/export volumes, tariffs, and company satisfaction. | Efficient seed import and export processes extend the seed market beyond national borders. While seed companies benefit from an expanded market, farmers can access a wider range of varieties from across the region. | YES | + |
| C. SEED POLICY AND REGULATIONS | ||||
| C1. Length and cost of variety release process | Length and cost of variety release process | Plant variety release is the process during which new varieties undergo various tests including yield, value for cultivation and use, and distinctness, uniformity and stability. Varieties that meet the test are approved for release by the National Variety Release Committee. A vibrant seed sector has a functional variety release system that is well understood by the relevant actors and is followed diligently. Lengthy and/or costly variety release processes can limit the number of released varieties which can adversely affect farmer choice. | YES | – |
| C2. Status and implementation of national seed policy framework | Status and implementation of various national seed policy instruments, including national seed policy, seed law, seed regulations, and ministerial orders and decrees. | Well-functioning formal seed sectors have effective coordinating institutions that work well together, following rules and procedures stipulated in clearly defined legal instruments that are updated regularly. | NO | +/- |
| C3. Harmonization with regional regulations | Status and implementation of regional harmonization of seed regulations. | African countries are increasingly opening their borders to regional trade (e.g., African Continental Free Trade Agreement). Harmonizing national regulations with regional ones opens up regional markets to seed companies and increases choice to smallholder farmers by facilitating the process of variety release across the region and encouraging seed trade. | NO | + |
| C4. Adequacy of efforts to eradicate counterfeit seed | Tracks prevalence of counterfeit seeds in country and efforts to eradicate problem. | Counterfeit seed threatens the seed sector in two important ways: one, it reduces farmers’ confidence in certified seed after farmers unknowingly purchase inferior quality grain labeled as certified seed. Two, it threatens the success of efforts to increase adoption of improved varieties. | NO | + |
| C5. Use of government subsidies | This indicator tracks the government subsidy program, including its assessment by seed companies. | Seed subsidies are intended as a short or medium-term measure to encourage farmers to adopt improved crop varieties. The design and execution of subsidy programs, in terms of the scale, targeting, distribution arrangements and payment systems, may contribute to the development of the seed market in positive ways or it may be disruptive to market forces. | NO | +/- |
| D. INSTITUTIONAL SUPPORT | ||||
| D1. Performance of national seed association | Tracks relevant aspects of national seed traders’ association, as reported by seed company members surveyed. | Well-functioning national seed trade associations play a key role in representing the interests of the industry and engaging with government. | NO | + |
| D2. Adequacy of seed inspection services | Number and adequacy of seed inspectors | Seed inspection services ensure that certified commercial seed meets the regulatory quality standards. To provide adequate inspection services requires sufficient numbers of well-resourced inspectors. | NO | + |
| E. SERVICE TO SMALLHOLDER FARMERS | ||||
| E1. Availability of agricultural extension services for smallholder farmers | This indicator tracks the ratio of agricultural extension officers to agriculture households | Well-functioning agricultural extension services are critical to the successful adoption of improved seeds by smallholder farmers. | NO | + |
| E2. Concentration of agro-dealer network | Concentration of agro-dealer network as measured by number of registered agro-dealers, ratio of agrodealers/household, and average number of agro-dealers seed companies work with. | Agro-dealers play a key role in closing the last mile in Africa’s seed distribution systems and are often the main point of sale for certified seed. | YES | + |
| E3. Availability of seed in small packages | Breakdown of total seeds sold by 4 different package sizes (2kg and below, 2-10kg; 10-25kg, above 25kg) as percentage of total seeds sold. | Because most farmers in Sub-Saharan Africa are small-scale, making seed available in small, more affordable packages is a good way to increase adoption rates among smallholder farmers. | YES | + |
| E4. Seed and grain prices at planting time | Indicator tracks the retail price of seed at the farm-gate and the price of grain, at the time of planting. | Comparing the price of seed and grain is important as, depending on the difference in price, smallholder farmers end up making a choice between purchasing seed from the formal sector or planting grain. | YES | +/- |